Home Dashboard and Custom Widgets
A home screen that sums up today's time at a glance, plus a widget board you assemble from the cards you care about.
These images are illustrations of the concept, not screenshots of the actual product.
Overview
The home dashboard is where people land after signing in. This concept illustrates two related views: a fixed Dashboard that answers the basic question of how the day is going, and a Widgets Dashboard that lets each person assemble the cards that matter to their own work.
Time data is only useful if it is easy to read. Many tools bury the day's totals behind reports or give everyone the same generic summary, so a freelancer watching billable hours and a lead watching a team's activity end up hunting for different numbers in the same place. The design gives everyone a consistent summary at the top and lets the rest of the screen adapt.
In the first illustration, four stat cards show today's tracked hours, billable hours, the number of active timers and the count of time entries. Below them, a Recent time entries list shows each entry's project name with a Running or Completed status badge, a Quick summary card restates the day's key figures in short lines, and a grid of six Quick Actions jumps to starting a timer, viewing projects, time entries, team activity, reports and approvals. The second illustration shows the Widgets Dashboard: an Active Timer card with pause, stop and Log Time controls; Project Progress with a completion ring, milestones and a deadline; a Focus Score gauge with deep-work hours and a session count; Team Stats with members online and a productivity sparkline; Billable Hours against a weekly goal with a daily bar chart and top client; and a Task Overview split into pending, in-progress and completed counts. An Add Widget panel lists the available card types as checkboxes, with Add selected and Cancel actions, and a Create Widget button sits below it.
Both views draw on the same data as the rest of TimeCampus: timers and time entries, projects and tasks, focus scoring and team activity. Each card is designed as an entry point into its fuller screen, so the dashboard works as a starting point for the day rather than a dead end.
What this concept shows
- Four headline stat cards for today's tracked hours, billable hours, active timers and entry count
- A recent time entries list with Running and Completed status badges
- A short quick summary of the day alongside six quick-action tiles
- An Active Timer widget with pause, stop and Log Time controls
- Project Progress, Focus Score, Team Stats, Billable Hours and Task Overview widgets with rings, gauges and charts
- An Add Widget panel for choosing which cards appear, plus a Create Widget action
How it works
- Sign in and land on the Dashboard to see today's tracked, billable and active time in the stat cards.
- Scan the recent time entries to check which work is still running and which is complete.
- Use a Quick Action tile to start a timer or jump to projects, entries, team activity, reports or approvals.
- Open the Widgets Dashboard for a personal view of timers, projects, focus, team and billing.
- Choose Add Widget, tick the card types you want and add them to the board, or create a new widget.
- Work from the widgets during the day, for example logging time straight from the Active Timer card.
Who it's for
- Individual contributors checking how their day is going
- Freelancers watching billable hours against a goal
- Team leads keeping an eye on team activity
- Project managers tracking progress against deadlines
Illustrations
2 illustrations of this concept. Select one to view it full size.
Home Dashboard With Today's Totals
This illustration shows the home Dashboard inside a frosted app frame with a slim icon rail on the left and a search field and profile avatar at the top. A welcome heading introduces the page as the product's privacy-first time-intelligence home. Four large stat cards follow, labeled Today, Billable, Active timers and Entries, each holding a single sample figure. Beneath them, a Recent time entries table lists project names with a Status column that uses Running and Completed badges. In the center, a Quick summary card restates billable hours, active timers and the entry count in short lines. On the right, a Quick Actions grid offers six tiles with icons: Start Timer, View Projects, Time Entries, Team Activity, Reports and Approvals. The design keeps the day's key numbers and the most common next steps on a single screen.
Widgets Dashboard With Add Widget Panel
This illustration shows a Widgets Dashboard with an Overview subtitle and six glass cards in a grid, each with an overflow menu. An Active Timer card shows a project, a task and a large running clock with pause, stop and Log Time buttons. Project Progress pairs a completion ring with tasks done, a deadline and milestones. Focus Score shows a daily score gauge rated Good, a small trend line, deep-work hours and a session count. Team Stats lists members online with a productivity figure and a bar sparkline. Billable Hours tracks a weekly total against a goal, with a Monday-to-Saturday bar chart and a top client. Task Overview splits tasks into pending, in-progress and completed counts above a short task list. On the right, an Add Widget panel lists six widget types as checkboxes with Add selected and Cancel buttons, above a Create Widget action. All names and figures are sample data.
Topics
- time tracking dashboard
- customizable dashboard widgets
- billable hours widget
- focus score widget
- daily time summary
- active timer widget
- project progress tracker
- team stats dashboard
- time tracking quick actions
Related concepts
Privacy-First Sign In
A sign-in page that states the promise up front: see where your time goes, without timers or surveillance.
1 illustration
Timer and Time Entries
Start a timer when you want to track deliberately, then review, filter and edit every entry in one billable-aware list.
2 illustrations
Focus Score and Work Patterns
A single focus score, the deep-work and interruption figures behind it, and the weekly rhythm that explains both.
2 illustrations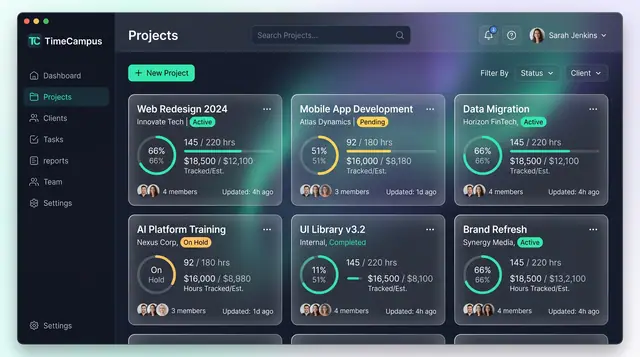
Projects and Tasks
Projects, budgets and task lists tied to the hours actually spent, so progress and burn are read from the same record.
3 illustrations